
Citibke Part 2 : EDA
This is the second in a series of blog posts i’ll be writing on a project to analyze NYC citibike data. The first post focused on collecting and preparing the data, and a strategy for dealing with a very large data set. In this part, i’ll be doing some EDA (exploratory data analysis) of the data to identify patterns and inform modeling, which i’ll detail in part 3 of the series. There are a ton of different questions I could ask/explore in this dataset; i’ve chosen to focus on the number of rides each day and the factors that affect them. My ultimate goal is to try to predict the number of rides taken across the system for a give day. Below i’ll show some of the findings from my EDA; you can see my EDA notebook here.
Results
First I wanted to examine the number of rides taken and it’s evolution over time. I’ll look at the number of rides taken each year, month, and day:
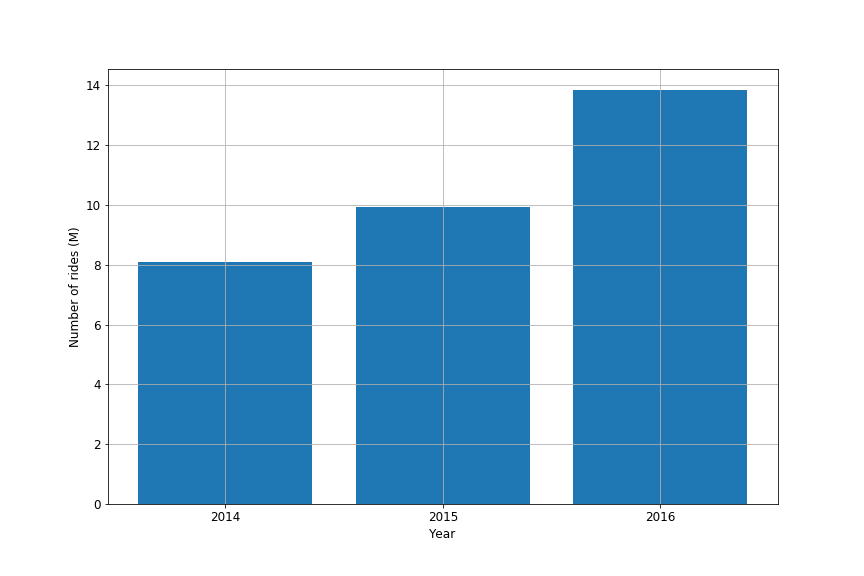
Number of rides per year
The number of rides has increased each year.
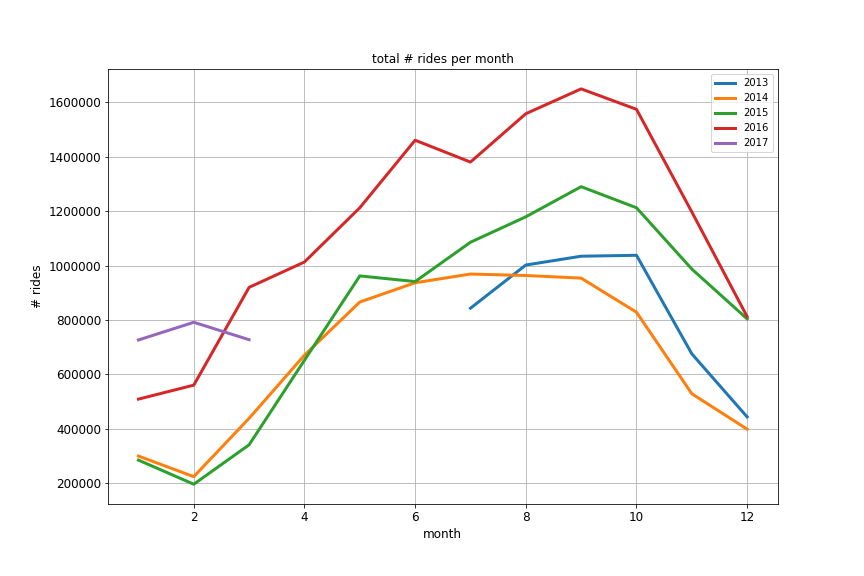
Number of rides per month
The number of rides per month shows a similar seasonal cycle in each year; the peak occurs in September and the minimum occurs near February. This is likely related to the seasonal weather pattern; we’ll investigate this further later.
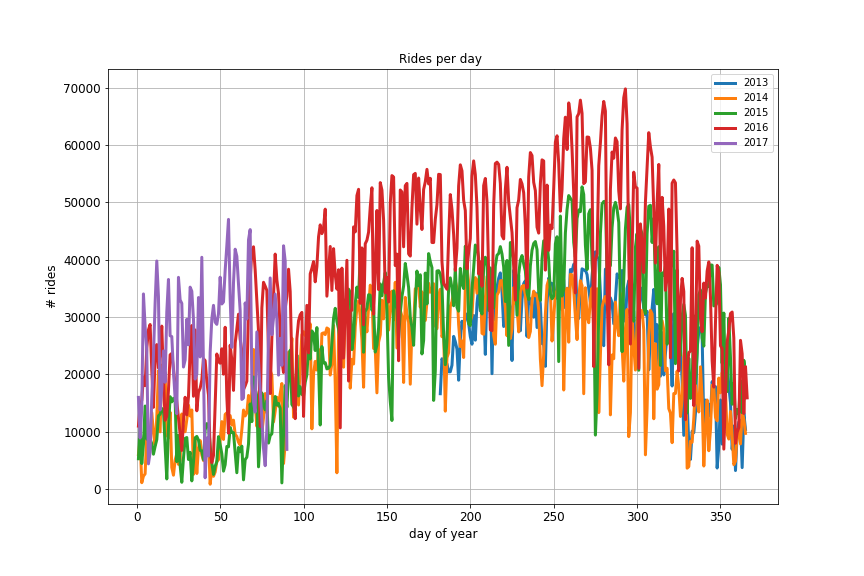
Number of rides per day
The number of rides per day shows a similar seasonal pattern, but you can see there is also a lot of higher frequency variability.
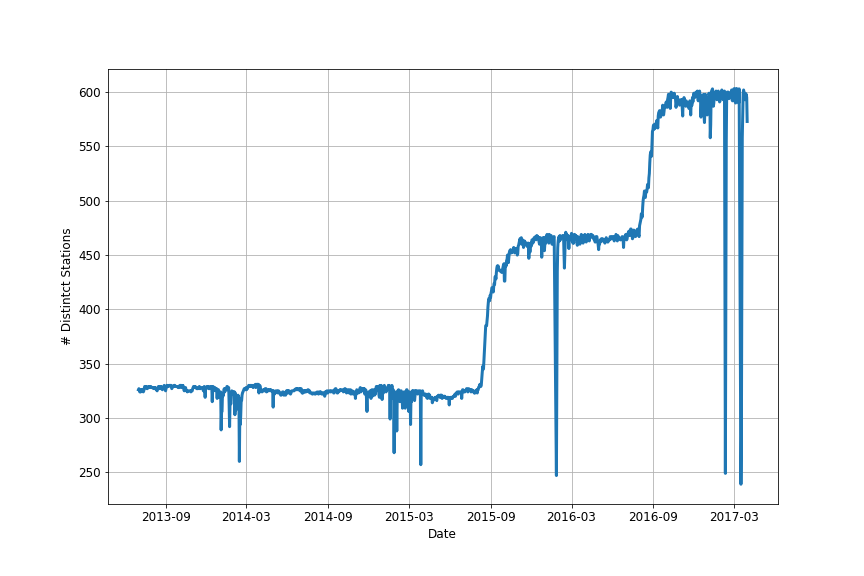
Is the increase in rides over time due to more bikes/stations?
Besides people taking more rides, the increase over time could be due to increased capacity of the system (more stations and bikes).
Number of stations over time
The number of stations has increased each year, which probably explains a large part of the increase in the number of rides each year.
Number of bikes over time

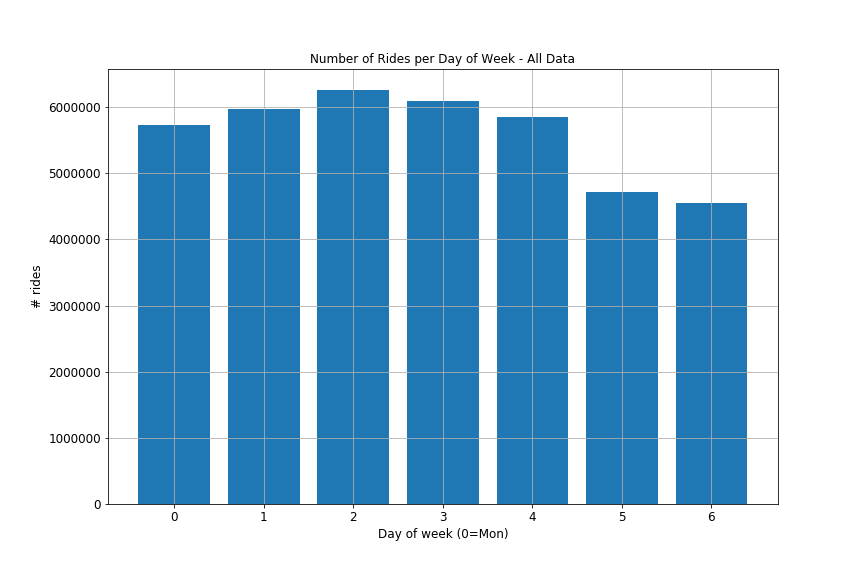
Rides by day of week
Wednesday has the largest number of rides, and the weekends tend to have fewer rides than weekdays.
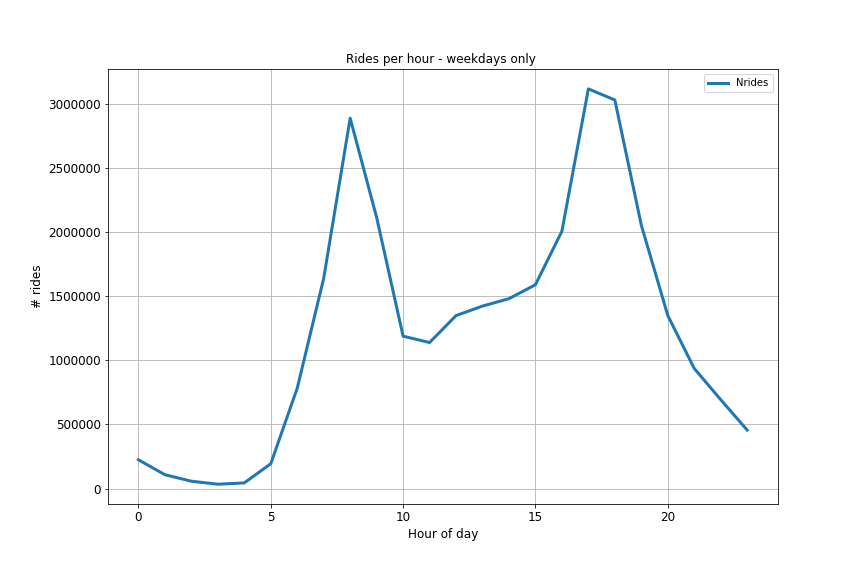
Rides by hour of day
The number of rides per hour shows two peaks; one near 8am and another near 5pm. This suggests a lot of the rides are people commuting to/from work.
Weekdays only
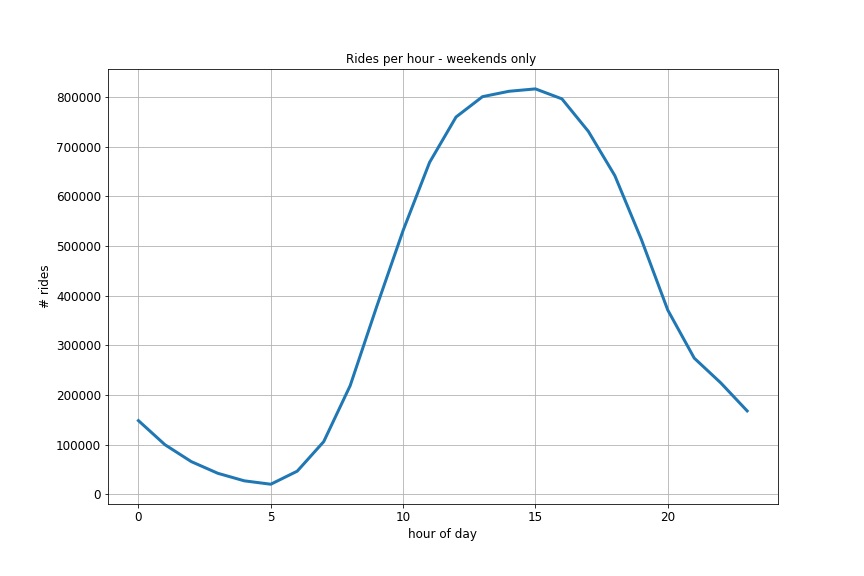
Weekends only
The hourly cycle of rides on weekends only looks very different, with a peak in the early afternoon.
Trip duration by day of week
Ride locations on weekends vs Weekdays
Examining the stations with the most rides on weekends vs weekdays qualitatively supports the theory that rides during the week are mostly commuting to work, while those on the weekend are more for pleasure. During the week, the stations with the most rides tend to be transit hubs. On weekends, some of the stations with the most rides are near Central Park. You can see maps of this in this notebook (I couldn’t find an easy way to embed the interactive maps in this post).
Relationship between rides and weather
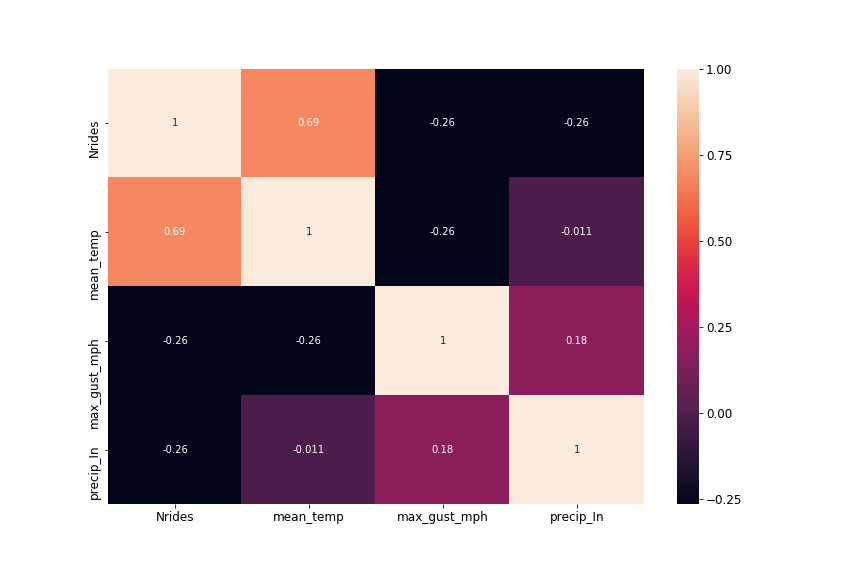
Correlations
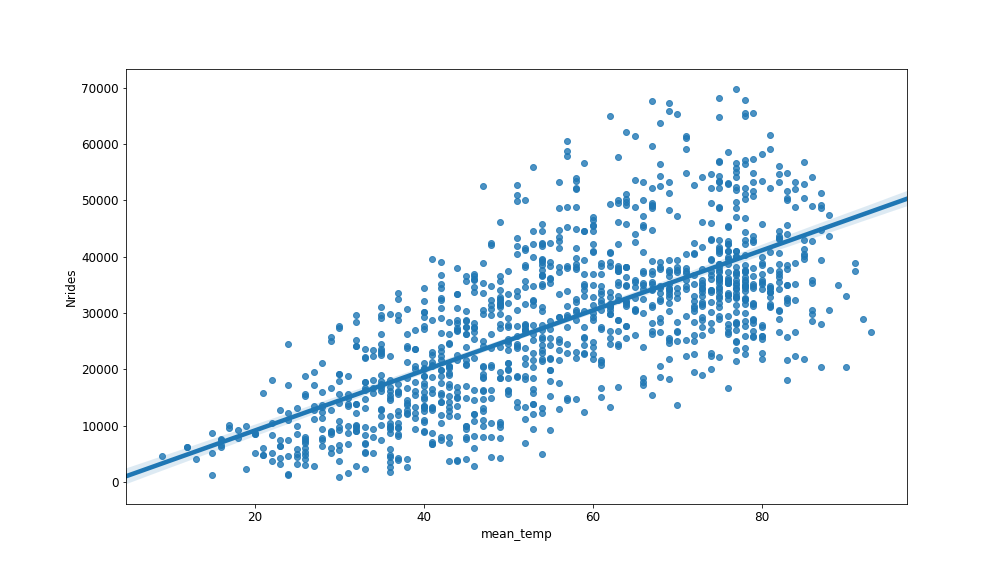
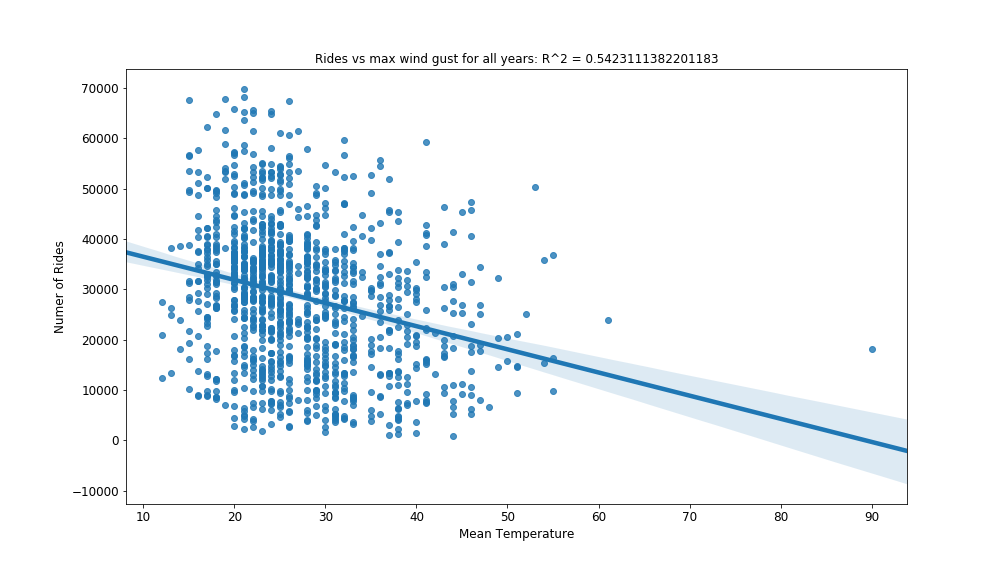
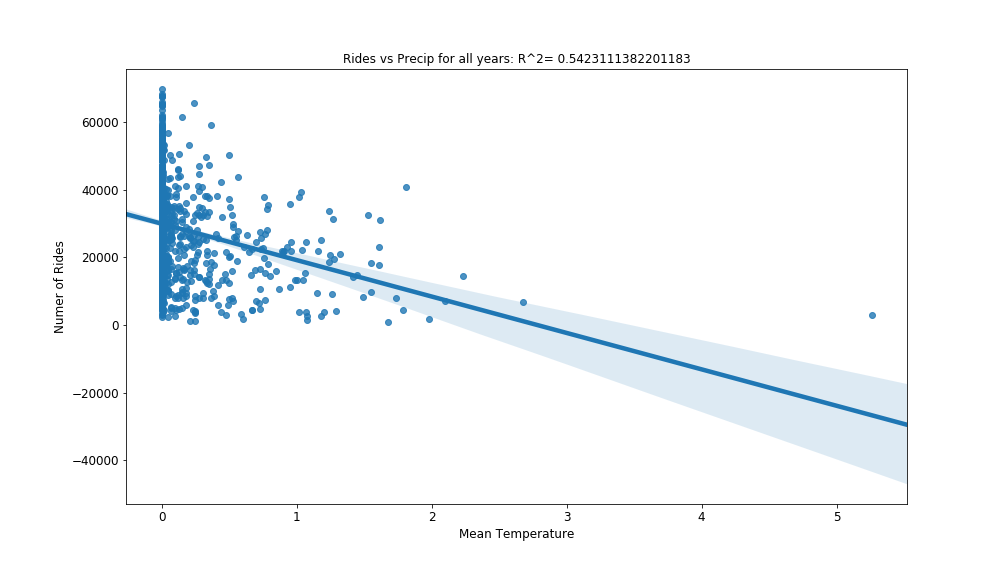
- The number of rides has a strong positive correlation with temperature, and weaker negative correlations with wind gust and precipiation.
Number of Rides vs Temperature
Number of Rides vs Wind gust
Number of Rides vs Precipitation
Conclusions
- The number of rides is increasing over time. This is at least partly due to increases in the number of stations and bikes.
- The daily and hourly patterns indicate that rides during the week are mainly commuting, while those on the weekend are more for recreation.
- There is a strong seasonal cycle in the number of rides taken. This is probably due to seasonal patterns in weather.
- Weather is significantly correlated with the number of rides taken. More rides are taken when temperatures are warmer, and less are taken when there is rain.
- A model predicting the daily number of rides taken should take these findings into account. Possible predictors include day of week, number of stations/bikes, temperature, precipitation, and wind gust.