
Clear Creek Rising: Analyzing USGS Stream Gauge Data
One of my favorite things about Golden is Clear Creek. It runs right through downtown, and is lined by walking/biking paths and parks. Most of the year it is an idyllic, slow flowing creek perfect for tubing, swimming, and letting your dog cool off. On some hot summer days, there are so many tubers it looks like a lazy river at the water park.
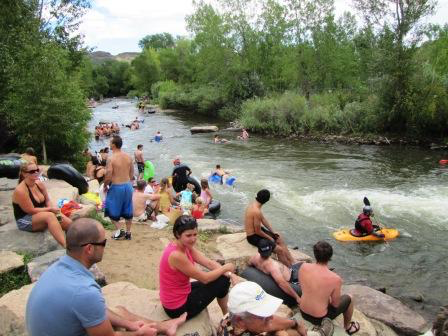
Summer fun on Clear Creek. Image from http://www.goldenvisitorsbureau.com/gvcactivities.php
But if you come in June, you’ll probably find more of a raging river. As the temperatures climb up into summer, all that snow in the mountains starts melting and flowing down Clear Creek into Golden. I especially love to walk by the creek during this time and watch it rise and speed up. The police usually close the creek to tubing or swimming during this time because it is too dangerous . The only people on the water during this period are the experienced white water kayakers, and fire departments from around the area practicing swift-water rescues.
Normally I judge the level of the creek by how far underwater the fish are by the Washington Ave. Bridge, but as a scientist I figured I should use something a little more accurate :).
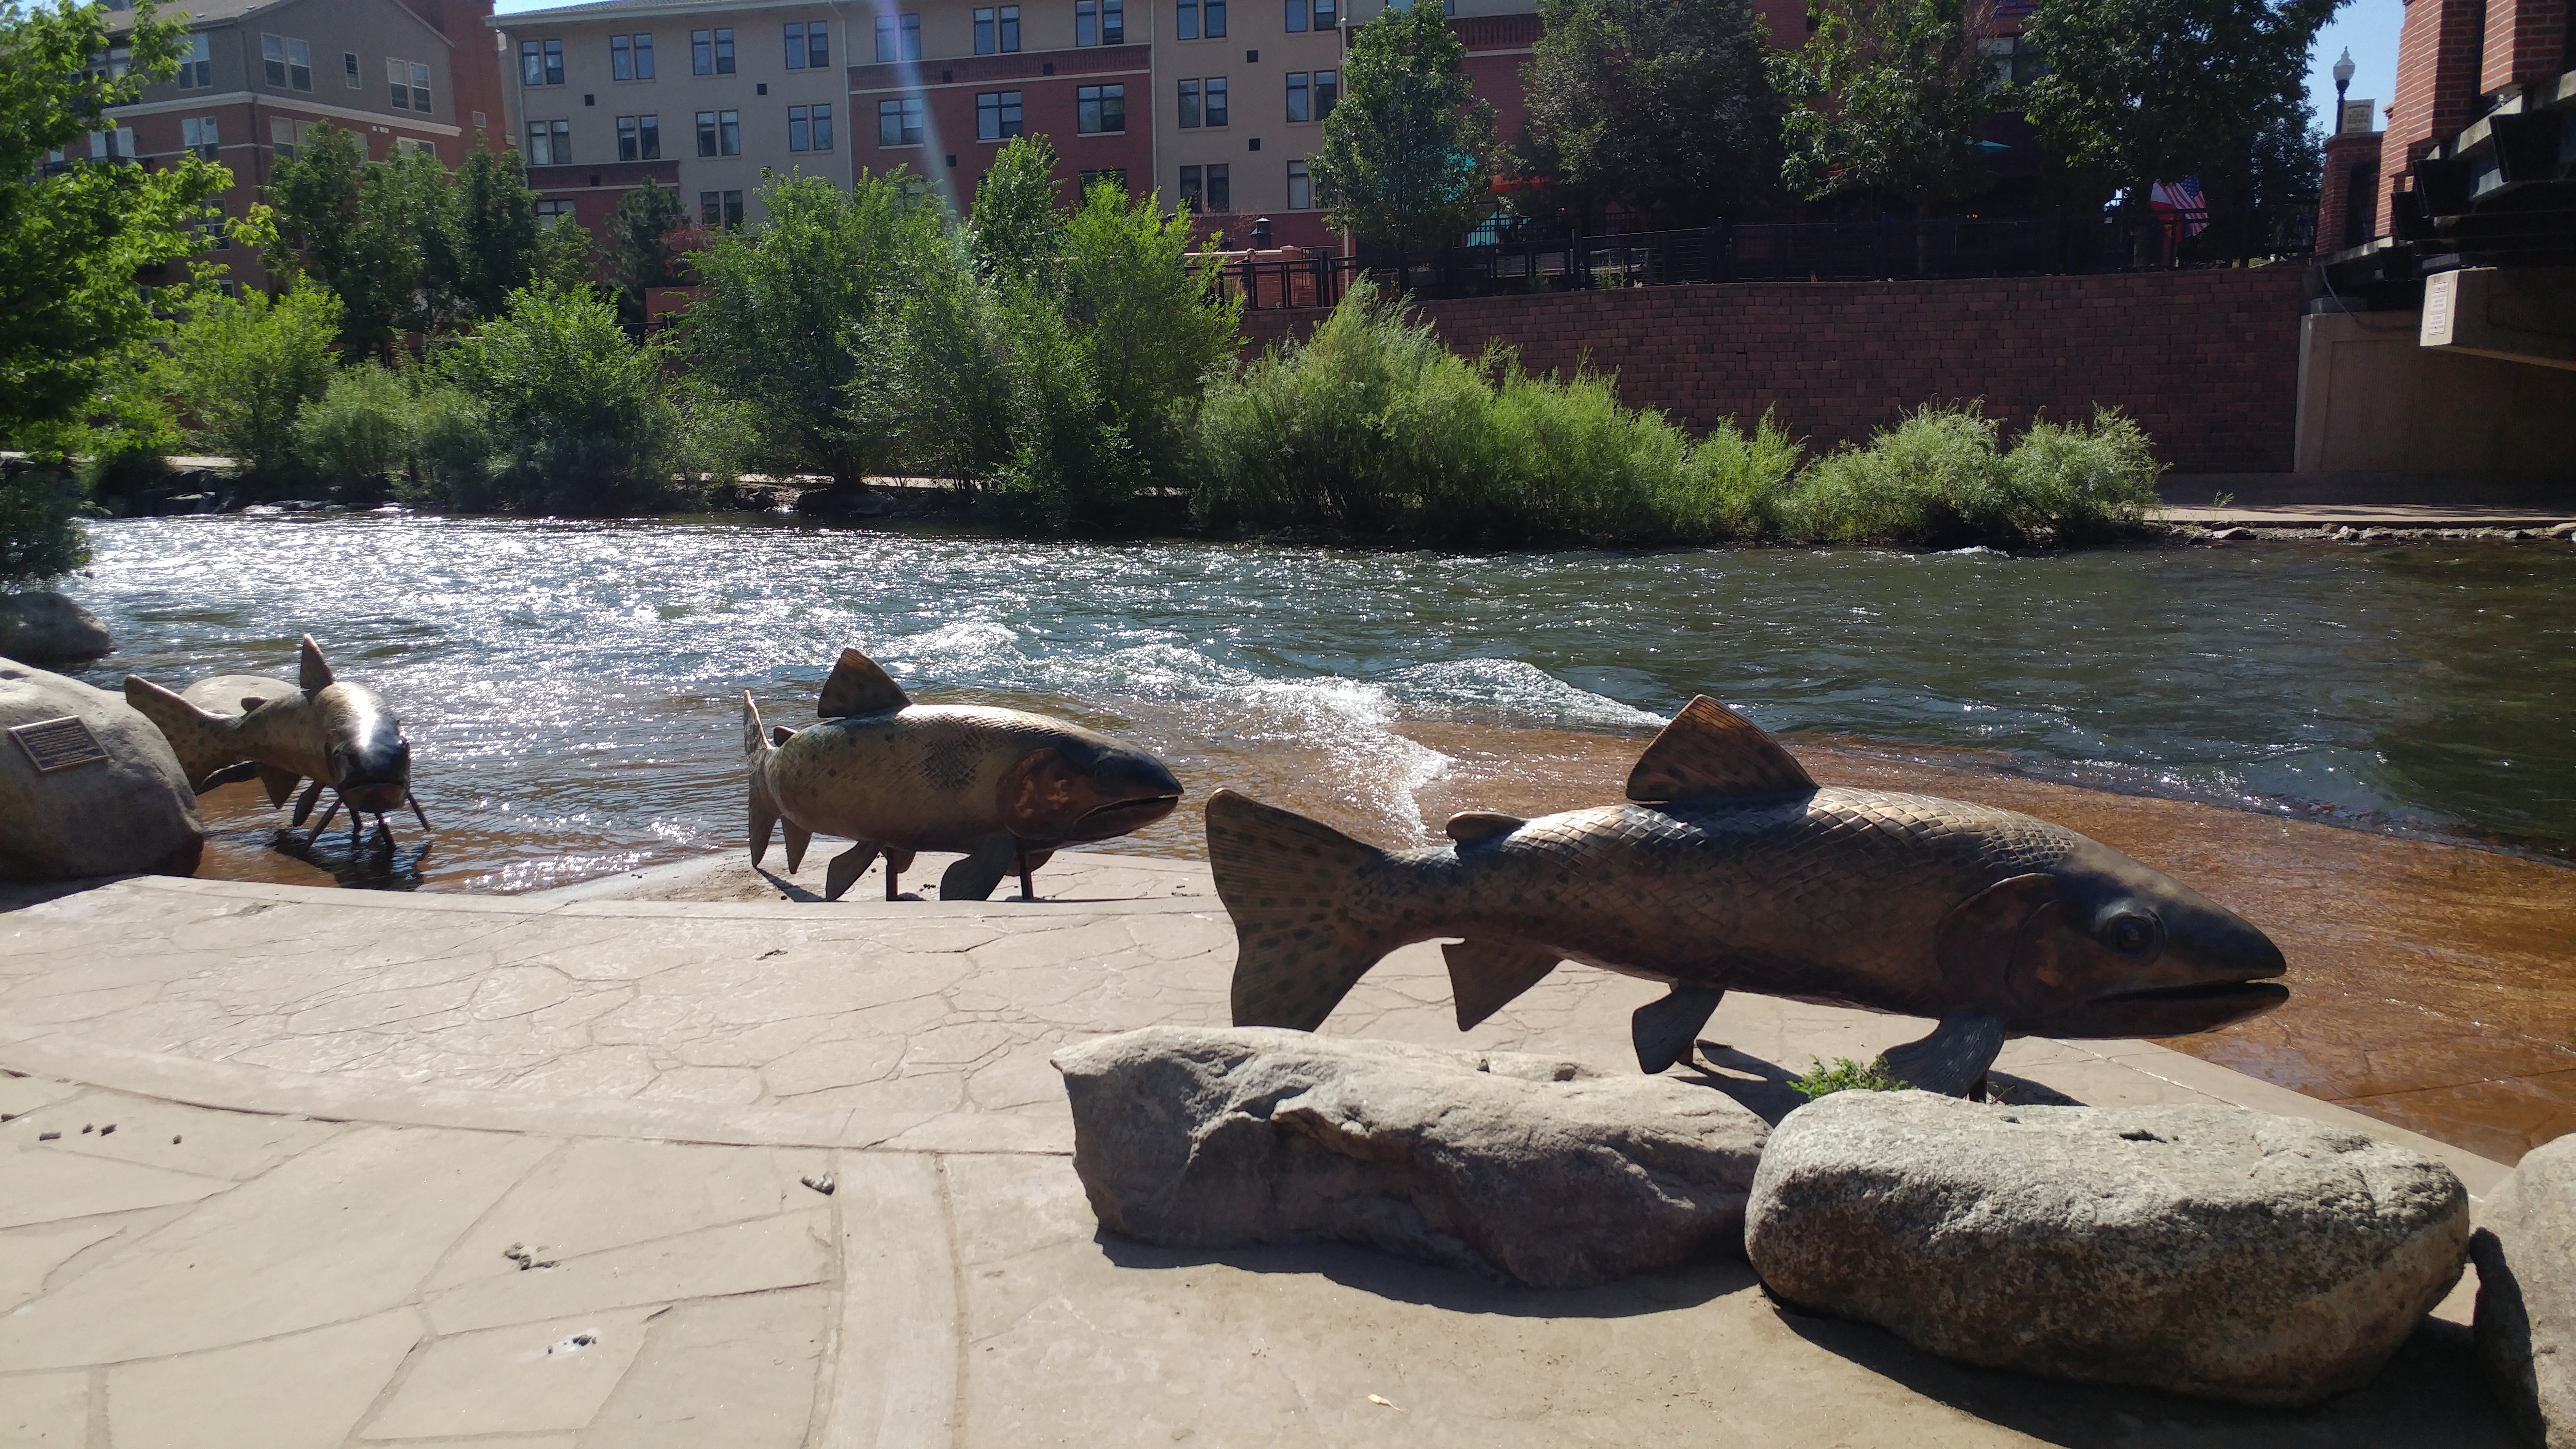 The fish just east of the Washington Avenue Bridge on Clear Creek in Golden. They would be in the water during the peak spring runoff
I knew that the USGS has stream gauges along the creek, so I decided to try to get the data and do some analysis. The gauge is on the north side of the creek just east of the US6 bridge. If you’ve walked west on the path from Golden, you’ve probably walked by it or seen it before. The USGS website has a bunch of data visualization tools, but I wanted to download the data programmatically so I could do my own reproducible analysis. I was happy to find that the USGS also has an API (https://waterservices.usgs.gov/rest/IV-Service.html#URLFormat) that lets you search for and download data for stream gauges across Colorado (and the country?), going back to 2007. I’ll use python for this analysis, though you could easily do the same thing in R. I first constructed the url to request this data, specifying parameters as outlined on the API information page:
base_url = 'http://waterservices.usgs.gov/nwis/iv/?'
site = '06719505' # site number for Clear Creek in Golden
format_out = 'json'
indent = 'on' # indent json output for easier viewiing
variable = '00060' # discharge, cubic feet per second
startDT = '2007-10-1'
endDT = '2017-7-10'
request_url = base_url + 'site=' + site + '&format=' + format_out + '&indent=' + indent + '&startDT=' + startDT + '&endDT=' + endDT + '&variable=' + variable
Then I used the requests library in python to actually get the data:
resp = requests.get(request_url)
js = resp.json()
, and figured out how to extract the data into a pandas dataframe (see my github repository for details). With the data in a pandas dataframe, I could now easily explore and visualize it.
2017
First I looked at the 2017 data around the peak runoff, which appears to be occur around June 11 (the news article linked above about the closing of the creek was dated June 12). Another interesting feature is that there appears to be some kind of diurnal cycle, probably related to the daily cycle of temperature/melting at it’s source(s). I’d like to look into this more in the future, using air temperature data from locations closer to the source.
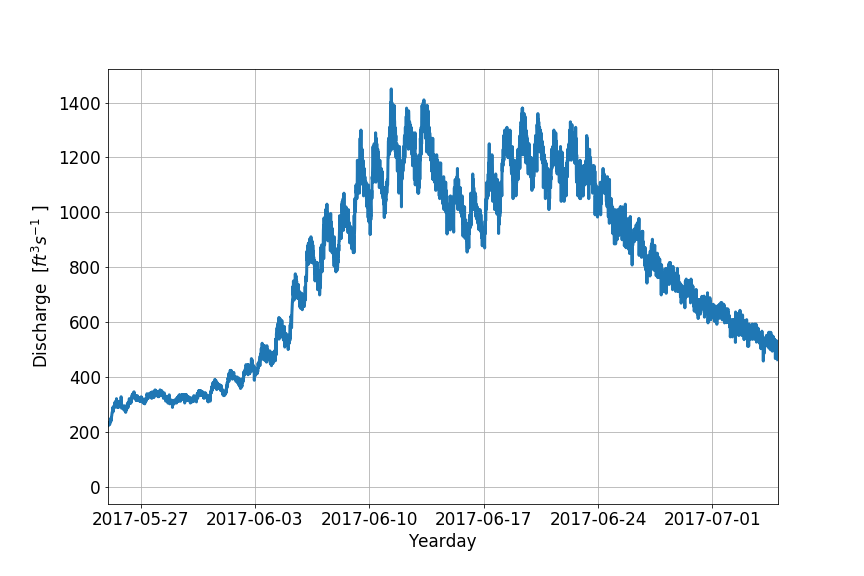 Discharge measured at Golden USGS stream gauge on Clear Creek during the 2017 peak spring melt.
Going back further
Next I looked at the data for all years, back to 2008. The magnitude of the peak discharge varies from year to year, and in some years there are two peaks close together (probably a warm period, followed by a cold period, followed by another cold period ).
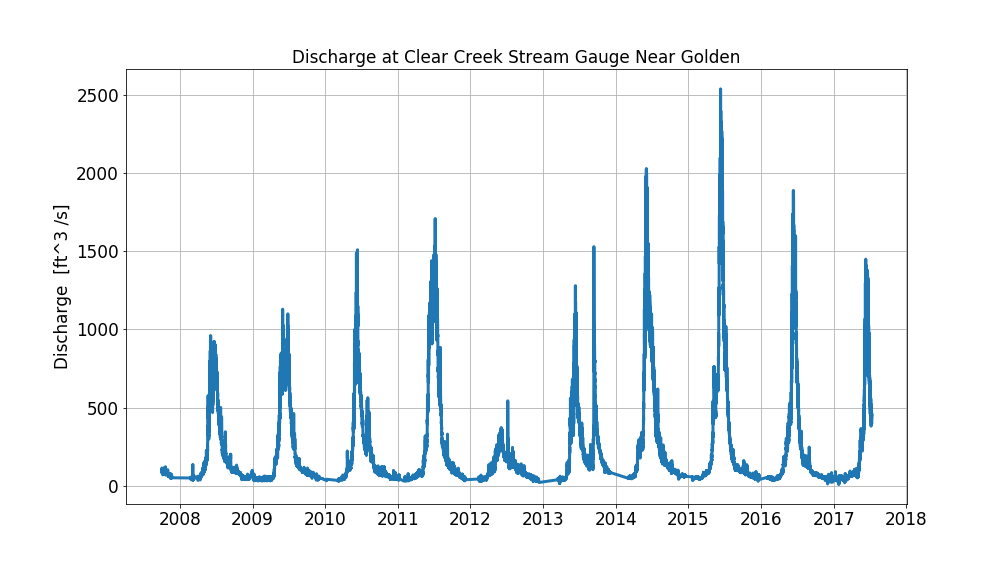 Discharge measured at Golden USGS stream gauge on Clear Creek
I also wondered if there was any sort of trend with peak runoff occurring earlier in the year, due to climate change. There doesn’t seem to be a clear pattern I can discern from this data. I think there is a lot of natural variability in the timing, and a longer time-series would be needed to identify a trend.
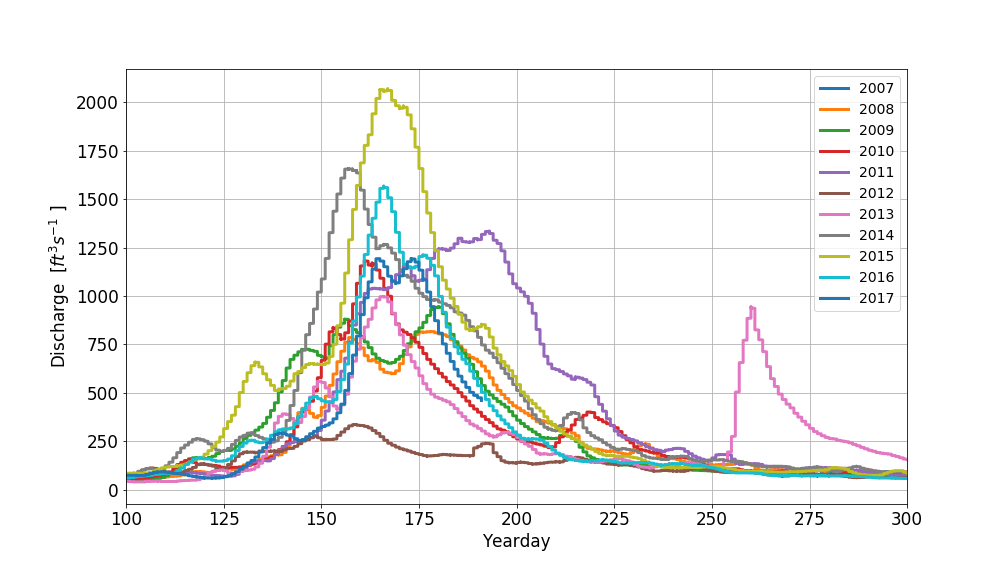 Discharge measured at Golden USGS stream gauge on Clear Creek during peak runoffs for all years going back to 2008.
2013 Floods
In 2013, you might notice there is also a 2nd peak later in the year, which is even larger than the spring runoff. This corresponds to a major flooding event in 2013. I wasn’t yet living in Colorado in 2013, but if you were you probably remember it (especially if you were living near Boulder or along the front range). The plot below shows how quickly the water rose!
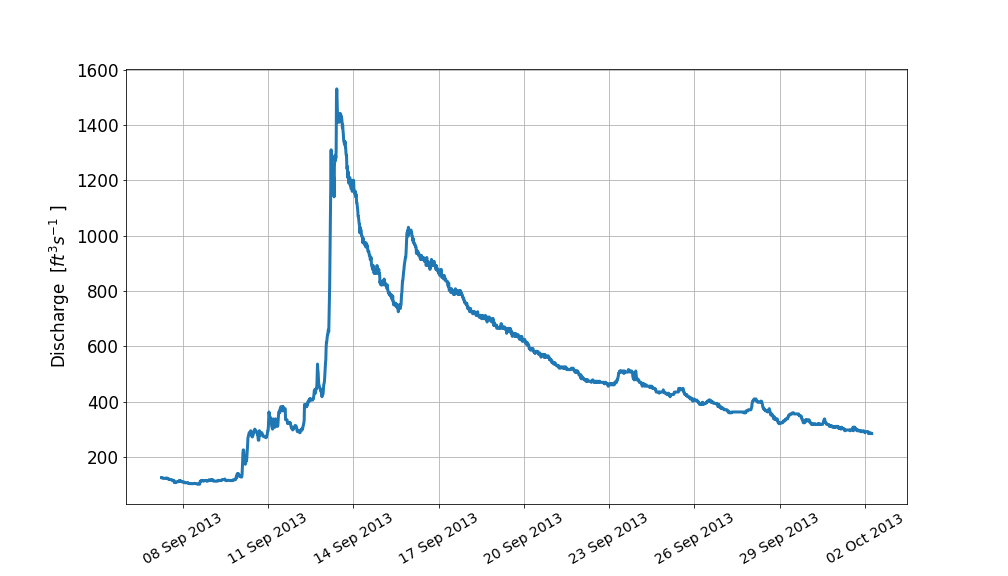 Discharge measured at Golden USGS stream gauge on Clear Creek during the 2013 floods.
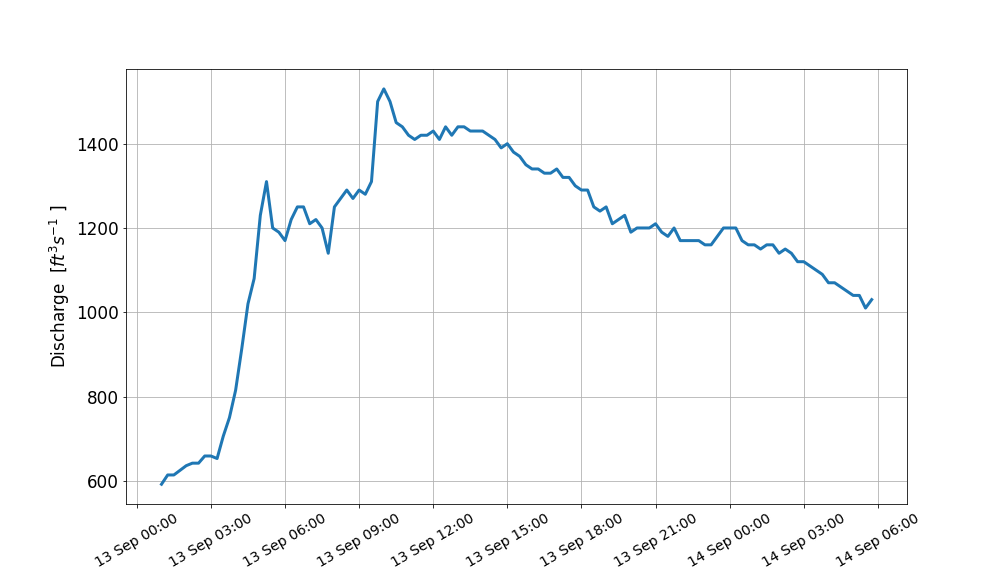 Zoom-in of Discharge measured at Golden USGS stream gauge on Clear Creek during the 2013 floods.
Up Next
In the future, I plan to investigate this data further and look at other stream gauges on Clear Creek between Golden and the continental divide. Some of the questions i’ld like to examine include:
- What time of day does peak snowmelt occur? Does this correlate with temperature at higher elevations?
- How long does it take for changes at the divide to propagate downstream (look at different stream gauges along clear creek)?
Stay tuned!