
GoldenStreamGauge: A Shiny app for visualizing stream flow and weather conditions on Clear Creek in Golden CO
Overview
As you may know from previous posts, i’ve been interested in looking at stream flow along Clear Creek in Golden, CO during the spring snowmelt season. I made a Shiny app called *GoldenStreamGauge’ that allows you to easily visualize streamflow, as well as several variables from a snotel station at Loveland Basin, the headwaters of Clear Creek.
Using the app
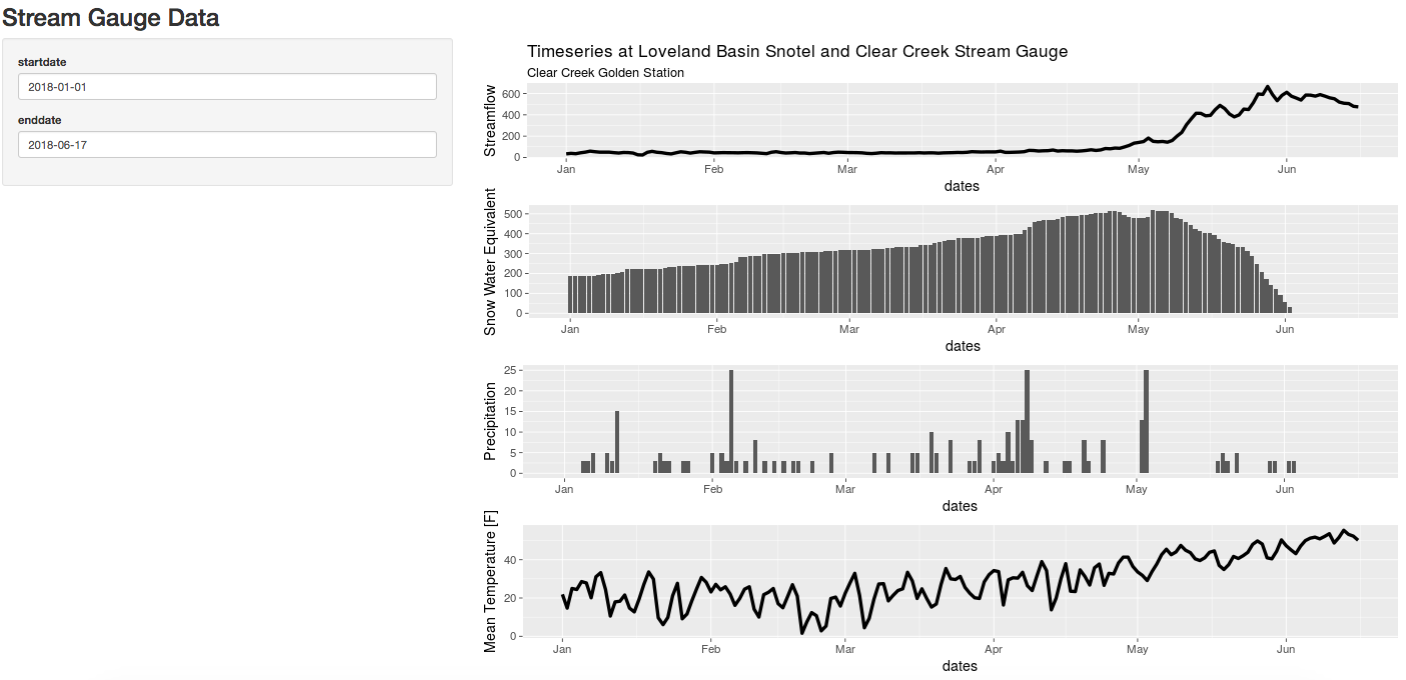
Using the app is very simple: You select a date range, and it plots timeseries of streamflow, temperature, snow-water equivalent, and precipiation for that period. The default time period is from 2018-01-01 to the current date.
Data
Stream Flow Data
Streamflow data are from the USGS stream gauge station on Clear Creek in Golden CO. If you are familiar with the area, it is located along the path by the creek, just east of the US 6 bridge. Data was downloaded using the waterData package.
Weather and snow-pack data
The precipitation, temperature, and snow water equivalent data are from a snotel](https://www.wcc.nrcs.usda.gov/snow/) station, obtained using the snotelr package. Currently this does not support custom date ranges so it downloads all data, which takes some time. Therefore, I downloaded the data and load it from a saved .rds file in the app. This speeds up the app quite a bit; the only drawback is that the file needs to be updated to have the most current data. In the future, I may write a chron job to download the data each day, and store it in a cloud location such as S3, from which the app could load it.
Future Improvements
I am considering several future improvements to the app, including:
- Updates to the snotel data as discussed above.
- Adding additional stream gauges along clear creek.
- Adding additional snotel stations.
- Adding maps showing the location of data sources.
You can view the source code for the app, as well as submit bugs or requests, here.